Recent Interstate Movers Into And Out Of Wisconsin
Have There Been Changes This Decade?
A Census data brief by the Applied Population Lab
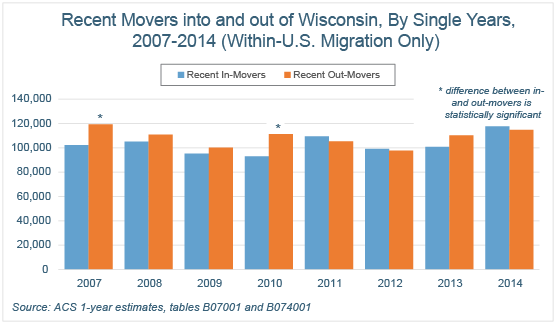
The state of Wisconsin was a strong gainer of migrants during the 1990s and the first half of the 2000s. However, since the start of the Great Recession in 2007, the movement of people into and out of Wisconsin has been relatively neutral: the annual average of in-movers from other U.S. states has been 103,000, the number of out-movers to other U.S. states has been 109,000. The range has been fairly steady as well: from 93,000 to 118,000 in-movers, 98,000 to 119,000 out-movers.
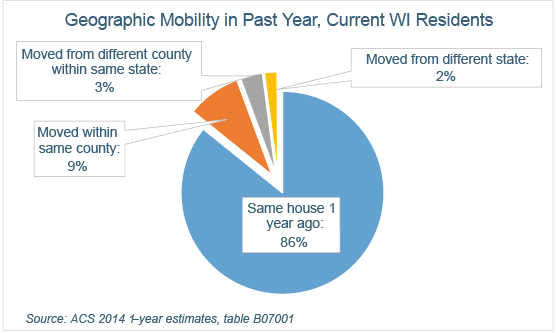
Interstate movers represent about two percent of Wisconsin’s population each year. Typically, nearly seven out of eight Wisconsin residents report living in the same house that they did one year previously; just under 10% move within their county, and 3% move to other counties within Wisconsin.
While the in- and out-totals have been relatively balanced, have there been any changes in the characteristics of recent movers? Has there been a shift in the age of recent in- and out-movers?1 In their educational level? In the racial and ethnic make-up? The Census Bureau's recent release of ACS estimates covering the 2010-2014 period can be compared to Wisconsin's domestic migration experience of 2005-2009.
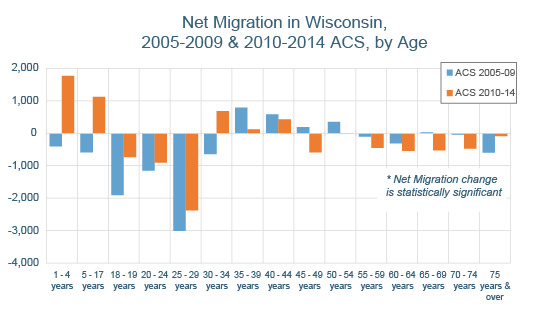
Recent Movers by Age
Compared to 2005-09, Wisconsin in the 2010-14 period saw gains in young adults ages 25-29 moving into the state, reducing the state's traditionally large net loss in this post-college age category. A reversal from net loss to net gain also appears to have occurred in the age 30-34 group, although the difference from the previous five years was not statistically significant.
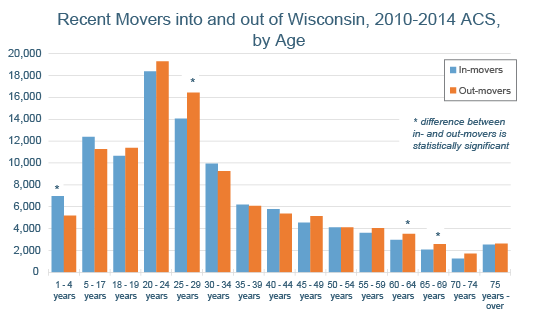
Consequently, with more young adults moving in, the number of children gained through migration increased. On the other hand, the number of "young" retirees (ages 65-74) leaving Wisconsin rose significantly.
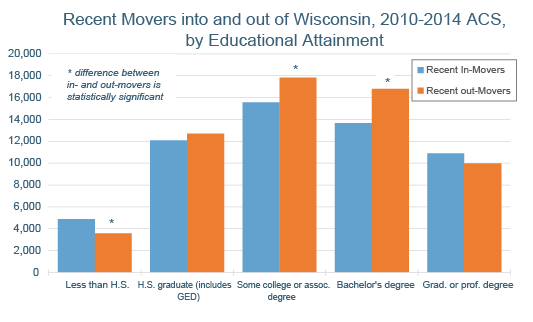
Recent Movers by Education Attainment2
In the 2010-14 period, Wisconsin saw significant net gains in recent movers with less than a high school diploma, but net losses in those with some college, an associate's or a bachelor's degree. This exact same pattern was seen in 2005-09.
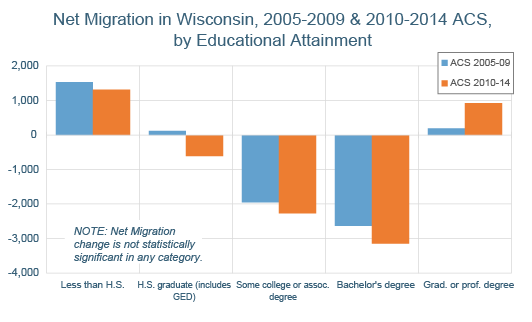
Compared to 2005-09, Wisconsin in the 2010-14 period saw only slight shifts in net gains and losses in the various categories of educational attainment, none of which were statistically significant. However, the state did make significant gains in holders of bachelor's, graduate or professional degrees from foreign countries (not shown on graph).
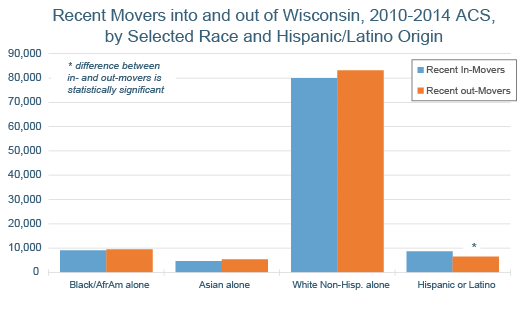
Recent Movers by Selected Race and Hispanic/Latino Origin
In the 2010-14 period, Wisconsin saw significant net gains in persons of Hispanic/Latino origin. However, for three race categories (Black or African American, Asian, non-Hispanic White), while slight net out-flows were indicated, none of the differences were statistically significant.
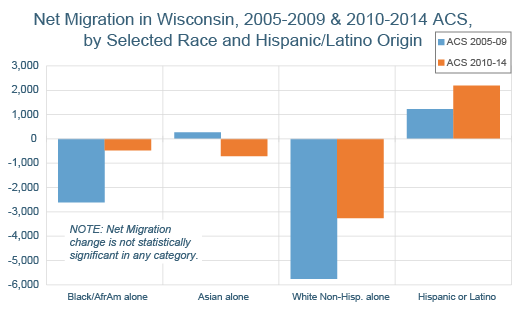
Compared to 2005-09, Wisconsin in the 2010-14 period saw no significant changes in net migration for selected race and Hispanic/Latino ethnicity categories. Annual in- and out-movement among white Non-Hispanics remained in a range of 80,000 to 90,000 across both five-year periods, with slightly less net loss occurring in 2010-14. In-movement of Hispanics/Latinos increased slightly in the 2010-14 years, while out-migration remained relatively level, generating a small but statistically insignificant net increase when compared to 2005-09.
Endnotes
- 1. The concept of "recent movers" is based on the Census Bureau's American Community Survey estimates of geographic mobility, which originate in a question asked of each person ages 1 and older as to where he or she lived one year ago. For larger-population geographies (65,000 or more residents), estimates are produced annually; for smaller areas, estimates are generated from an aggregation of surveys across five years. Values in the 5-year estimates are annualized weighted averages across the time frame.
- 2. Universe limited to ages 25 and over.